Analysis · Policy & regulation
The borrowers missing from the RBA’s buffer figures
The RBA’s buffer figures don’t tell the whole story, because the borrowers most likely to be short are the ones its data sees least.
The headline from the October Financial Stability Review is that the median mortgage holder has more than a year of repayments saved.
First home buyers who bought with a 5% deposit after October 2025 have had four rate rises since, and loans like theirs can take up to two years to show up properly in the data behind that figure.
That matters, because when commentators and politicians quote the headline, the detail is what gets dropped.
Close to half hold less than a year
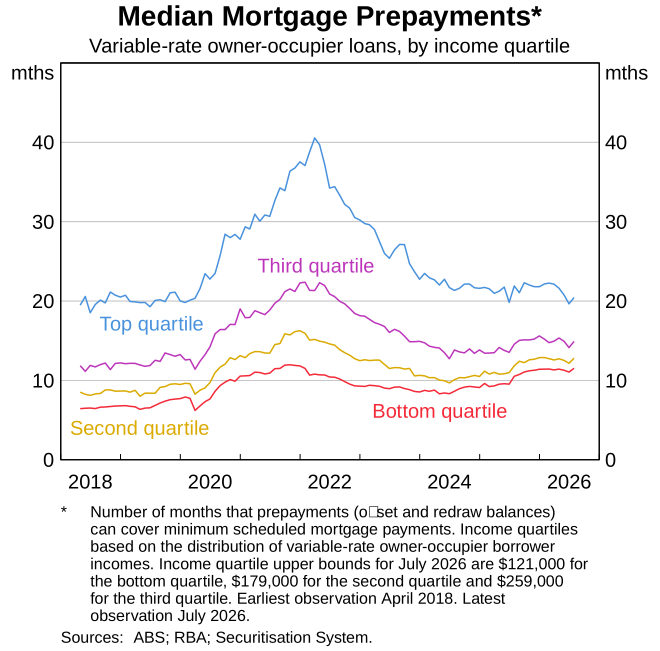
The RBA’s “more than a year” of savings describes the middle borrower, so close to half hold less. The figure is the median variable-rate owner-occupier’s savings in offset and redraw accounts, counted in months of scheduled repayments at current rates (RBA, 1 October 2026).
Buffers are bigger than before the pandemic in every income group. The typical borrower in the lowest-income quarter held about 6½ months in April 2018 and about 11½ months in July 2026, on the RBA’s chart.
That is a real improvement. It is also under a year, and the October review does not show how many borrowers hold less than one month, or three.
The lowest-income quarter here is not low-income Australia. Among variable-rate owner-occupiers, the bottom quarter earns up to $121,000 a year.
Only 7% of the lowest-income households have an owner-occupier mortgage, and 40% rent (RBA, October 2026). The lower-income households the RBA says rising costs strain most, many of them renters, are largely outside these figures.
The data arrives up to two years late
The newest loans are the slowest to reach the data behind the RBA’s buffer figures. The buffer, stress and negative-equity figures in the review all come from the RBA’s Securitisation System: loan-level data on mortgages that lenders have bundled into securities. It covers roughly a third of housing credit by value (RBA Bulletin, July 2024).
A loan takes about 18 months, on average, to enter that dataset. Loans above 80% LVR take up to about 20 months, and are significantly under-represented for up to two years.
The same paper found that loans with a high current LVR, and so the share in negative equity, are under-represented too. Its conclusion: unless other data fills the gap, this could bias assessments of the risk in new lending.
The October review says it adjusts its negative-equity estimate for these biases. The notes to its buffer and stress charts mention no such adjustment.
In fairness, the same paper found the dataset’s buffers, in total, broadly match the wider market. The gap is in which borrowers it sees, not in the overall sum.
The borrowers most likely to be short of a year’s savings are the ones the data has not caught up with.
Who bought in the blind spot
The buyers that data sees least are first home buyers who bought with a 5% deposit after 1 October 2025.
That day the government opened its 5% deposit scheme to every first home buyer, with no cap on places or income and higher price caps (Prime Minister, 1 October 2025). The government guarantees up to 15% of the property’s value, so these buyers pay no lenders mortgage insurance (RBA, October 2026).
The RBA’s evidence on these buyers comes from liaison, not data. Banks tell it hardship and arrears among scheme participants remain contained.
Its own footnote warns that arrears on recently written loans understate how they will perform, because new loans have had less time to meet a shock (RBA, October 2026).
Housing Australia’s latest published arrears figure, 0.3%, is from June 2025, and it said claims could pick up in 2025–26 as the loan book matures (Housing Australia, 2024–25 report).
Treasury expected more claims. Its analysis of the expansion said claims were expected to rise, particularly if the housing market deteriorated, and that high-LVR lending is associated with higher arrears in downturns.
It costed defaults at a 2% claim rate from actuarial modelling, while noting the scheme had so far seen far fewer (Treasury, 2025). House prices have since started to fall (RBA, October 2026).
A safety margin already part-used
A buyer approved in late 2025 has already used part of the safety margin they were tested against.
Every bank must test a new borrower at a rate at least 3 percentage points above the loan rate.
A buyer approved between October 2025 and January 2026 was tested while the cash rate was 3.60%. It is now 4.60% (RBA).
When approved
October 2025 to January 2026
- Cash rate at 3.60%.
- Tested at the loan rate plus 3 points.
Three points of headroom.
Now
October 2026
- Cash rate at 4.60%, 1 point higher.
- If the whole rise reached the loan rate, a third of the headroom is used.
About two points left, before any change in income.
The RBA’s reassurance holds, and so does the gap. Recent borrowers were tested at rates still above what they now pay, one reason the RBA expects stress to stay below its 2024 peak.
Its other reason, that some households short of cash in 2023–24 are expected to have had significant income growth since, describes borrowers who were already in the data then. It says little about buyers who started with a 5% deposit a year ago.
Stress is low, and rising
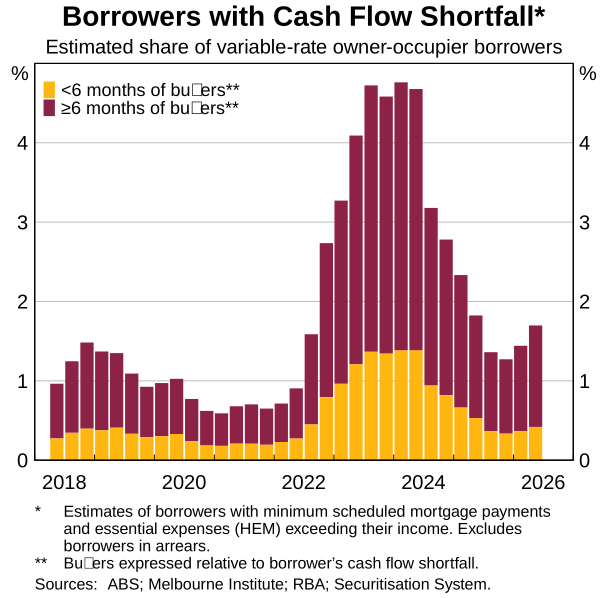
More mortgage holders are coming up short each month. The RBA tracks the share of variable-rate owner-occupiers whose income does not cover their repayments and essential spending.
On its chart, that share rose from about 1.3% at the end of 2025 to about 1.7% in June 2026; the text rounds it to around 2 per cent. Those who also have under six months of savings to cover the gap rose from about 0.33% to 0.42%.
In March the RBA put that most-at-risk group at around 0.3%. The October text gives no figure for it, saying most borrowers short of cash could cover the gap for at least six months by cutting back to essentials.
Both readings are far below the 2024 peak of almost 5%, and the share of borrowers persistently running down their offset and redraw balances has not risen meaningfully this year (RBA, March and October 2026).
What the stress estimate leaves out
- Investors and fixed-rate borrowers. It covers variable-rate owner-occupiers only.
- Borrowers already behind. Anyone in arrears is excluded from the count.
- What households actually spend. “Essential spending” is the Melbourne Institute’s HEM benchmark, not each household’s bills.
- Renters. The review’s comparison, 15% of renters short of cash against 4% of mortgage holders, uses HILDA survey data that runs only to 2022.
- The newest loans. It is built on the same dataset that is slowest to include them.
Loans approved outside the rules are at a high
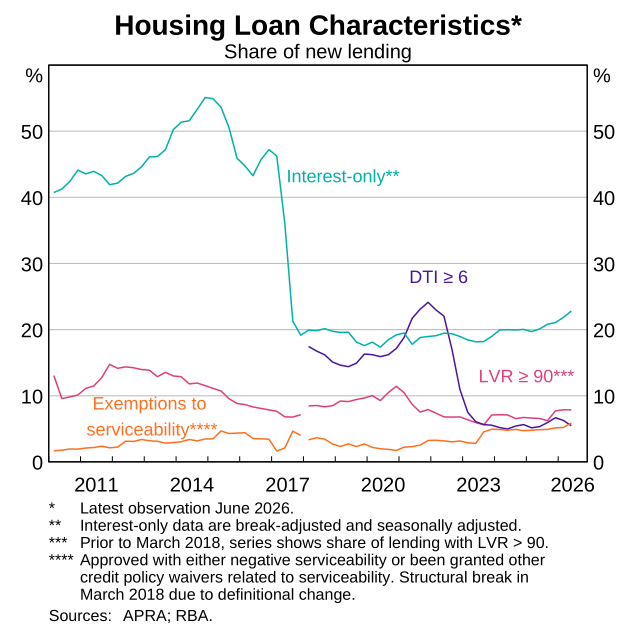
Loans approved despite failing the lender’s serviceability test were 5.8% of new lending in June 2026 (APRA, 17 September 2026), the highest point on the RBA’s chart of the measure, before or after its definition changed in 2018.
Lenders may make these exceptions for some loans, for example a like-for-like refinance. The October review calls the rise slight.
| Measure | Share | What the review says |
|---|---|---|
| Approved outside serviceability rules | 5.8% | A slight rise in the first half of 2026 |
| Interest-only | About 23% | Up over the year; not by itself a concern |
| 90% LVR or more | About 8% | Up since the 5% scheme expanded; still contained |
| Six or more times income | 5.6% | Well below APRA’s 20% limit |
The last jump came with an explanation, and this one does not. In late 2023 exceptions rose sharply to about 5% of new lending.
That followed an APRA letter on how banks should manage exemptions, and the RBA’s liaison suggests many were borrowers refinancing who no longer passed the stricter test after successive rate rises (RBA, October 2026).
The review does not say what is behind this year’s rise. If the pattern has repeated, more existing borrowers are failing the test they would face today, which is exactly the pressure the buffer figures are meant to reveal.
APRA left its lending limits unchanged, with the RBA’s support. The RBA expects the cap on loans at six or more times income not to bind: a guardrail for the next upswing, not a brake now.
Safe for the system is a different test
A financial stability review asks whether lenders and the system can absorb losses, and on that test the answer is reassuring.
Over 90% of banks’ non-performing home loans are well secured: the bank expects no loss because selling the home would repay the loan. The RBA acknowledges how distressing that is when it is a family home (RBA, October 2026).
The guarantee protects the lender, not the household. For 5% deposit loans, the government covers up to 15% of the property’s value if the borrower defaults, part of why the RBA judges the scheme low-risk for the system.
A buyer who defaults still loses the home.
The negative-equity scenario rests on the same dataset. It applies a uniform 20% fall to Securitisation System loans, all else unchanged.
That dataset under-represents loans with high LVRs (RBA Bulletin, July 2024), and the RBA’s own housing-price modelling says the risk of further falls is elevated.
Three numbers that would settle it
None of this means the RBA is wrong about the financial system. The case for calm is strong.
Banks report that arrears among scheme buyers remain contained, recent borrowers were tested at rates still above what they now pay, and over 90% of banks’ bad home loans are well secured (RBA, October 2026).
But that reassurance rests on the borrowers the RBA can see, and the most exposed recent buyers are still arriving in its data. Three published numbers would close the gap.
| The number | Who holds it | Why it matters |
|---|---|---|
| Savings buffers for loans under two years old | RBA and APRA | Shows whether the median hides a thin-buffer group of recent buyers |
| Arrears and hardship on guarantees issued since 1 October 2025 | Housing Australia | Its last published figure is from before the expansion |
| Serviceability exceptions split into refinances and purchases | APRA | Shows whether the record is squeezed refinancers or new risk |
Housing Australia’s annual report would carry the second. Its 2024–25 report appeared in September 2025; as at 5 October 2026, no 2025–26 report is listed (Housing Australia).
How we worked this out
The buffer, cash-flow and lending figures are from the RBA’s Financial Stability Review of 1 October 2026 and APRA’s June 2026 property exposure statistics. Where the RBA gives a figure only in a chart, we read the value off its published chart, so it may differ slightly from the RBA’s own rounding.
The data lag is the RBA’s own measurement, published in July 2024. Applying it to loans written since October 2025 is our reading, not the RBA’s. The remaining safety margin is our estimate and assumes the whole cash rate rise reached the loan rate.
We could not find published arrears or hardship figures for 5% deposit loans written since October 2025.

Sources
Figures verified as at 5 October 2026. Scheme rules and rates change — check the primary source before relying on any figure.
- Reserve Bank of Australia, Financial Stability Review, October 2026, Chapter 2: Resilience of Australian Households and Businesses — Text, endnotes 1, 3 to 7 and 12
- Reserve Bank of Australia, Financial Stability Review, October 2026, Graph 2.2: Borrowers with Cash Flow Shortfall — Values read from the chart by PropertyFacts
- Reserve Bank of Australia, Financial Stability Review, October 2026, Graph 2.4: Median Mortgage Prepayments — Values read from the chart by PropertyFacts
- Reserve Bank of Australia, Financial Stability Review, October 2026, Graph 2.8: Housing Loan Characteristics — Values read from the chart by PropertyFacts
- Reserve Bank of Australia, Financial Stability Review, October 2026, Chapter 3: Resilience of the Australian Financial System
- Reserve Bank of Australia, Financial Stability Review, March 2026, Chapter 2
- Andrew Hughes, How the RBA Uses the Securitisation Dataset to Assess Financial Stability Risks from Mortgage Lending, RBA Bulletin, July 2024
- Reserve Bank of Australia, Cash Rate Target
- APRA, Quarterly ADI property exposure statistics highlights, June 2026 — Published 17 September 2026
- Prime Minister of Australia, Uncapped 5 per cent deposits available for first home buyers from today, 1 October 2025
- Department of the Treasury, Home Guarantee Scheme Expansion: Supplementary Analysis, Office of Impact Analysis, 2025 — Pages 7 and 11
- Housing Australia, Home Guarantee Scheme Trends and Insights Report 2024–25 — Pages 9, 10 and 19
- Housing Australia, Trends and insights reports — Listing read 5 October 2026